The first question we were asked to work on was this one.
The following information concerning grades is posted on the bulletin board.
Test Grade    55   65   75   85   95
Z-Score        -2    -1    0    1     2
We were then asked to find the average. There were a number of ways people found it. But I will show you how I found it.
55+65+75+85+95 <- - - - - - - - - - - - I added all the grades together
5 <- - - then divded by the number of grades i added ( which was 5)
=75 < - - - - - - - - - - - -- -- - - - - - and thats how i got 75.
We then were asked which test score had a z-score of -2.76
this means which test score is -2.76 z-score from the standard deviation. The standard deviation is 75.
One way we found it ( which is completely correct )
was
-2.76=x-75 -2.76 is the z-score x is what we want
10 75 is the mean and 10 is the standard deviation
x=75-2.76(10)
=47.4
Now even though that was right. It is long and messy. So mr.k taught us a faster and more efficiant way of solving the problem which is the same thing but skipping 2 of those steps.
X=75-2.76(10)
=75-27.6
=47.4
x is what we want to find
75 is the mean
-2.76 is the zscore
10 is the standard deviation
we want to multiply the z-score we have by the standard deviation which tells us how many grades the grade we are looking for is from the mean. then subtract ( becuase the zscore was a negative number, if it were positive then we'd add) it from the mean, which will give us a score of 47.4
Our next question we were given two people, Tammy and Jamey who both applied for a job. Tammy scores 80 on her provinicial exam and the mean was 70 with a standard deviation of 4.2. Jamey score 510 on her company exam with a mean of 490 and a standard deviation of 10.3. We are to immagine that the company takes these two different exams and make them the same to figure out which one did the best. Who might get the job.
So we firgured out both girls z-scores
tammy jamey
M=70 mean 490
o=4.2 standard deviation 10.3
n=80 her score 510
80-70 510-490
4.2 10.3
=2.83 1.94
We chose Tammy because tammy's z-score was larger. This meant that she was 2.83 standard deviations ABOVE the AVERAGE of the group, where as even though jamey's test score was much HIGHER then tammy's she was only 1.94 ABOVE the average, makeing her average smaller then tammy's
Next we were asked to punch in alot of numbers in to our List1
After we placed all those numbers in our L1
we did this on our calculators
[place picture .c here]
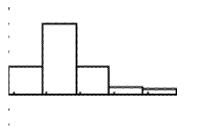
then to draw a histogram on our calculators. If you remember we we to our plots in our calculators andturned it on then chose historgrams. The made sure our xlist was L1 and placed our frequency at 1
To do this we
Then we change our window settings to
Xmin=-6
Xmax=73
Xscl=7.4
Ymin=-10
Ymax=30
Yscl=5
Xres=1
With that we should get a graph like so
Then we were asked if it was normally distubted and we looked at the numbers that we stored.
To figure this out we looked back at the set of numbers we punched into our L1
we also looked at what we stored in S and M, which were the Mean and the standard deviation. If you remembered they were
the M = 49.06
and
the S = 7.3929
The red circled numbers are the numbers within the first deviation of the mean. We found these numbers using what we stored. Remember we stored the MEAN of the numbers we punched in and the STANDARD DEVIATION.
To find -1 of the MEAN we subtracted the S from the M like this
x-o=49.06-7.39
=41.67
then we found the +1 of the MEAN adding S to M.
x+o=49.06+7.34
=56.45
When we counted the red circles up we found 39 numbers within one deviation of the mean. That is 39 numbers our of 50 which means there are 78% of the numbers that are within the first deviation of the Mean. We decided that this was not normally distributed because the normal distribution of data within one deviation of the mean is about 68%.
The red circled.
Ok lets end it with a Mr.K joke ( for those of you who missed it! )
Whats round on the outside and high in the middle?
OHIO... OH! ahahah get it...! OHIO... great joke Mr.K
unfotunately I've run out of time so i cannot finish the second half of the classes scribe till tomarrow afternoon. But if you were wondering who the next scribe is for tomarrow its iss......... TENNYSON
( i am having a bit of problems with the spell check so ... sorry about that )


Hi Nadiya,
ReplyDeleteNow that Ohio joke is a well known one around here!! And since Ohio State is in the Sweet 16 college basketball finals, we're hearing lots of the chant(now it takes at least two people to do this, one for the first part and one for the second) OH IO
It loses a lot in text :-(
Best,
Lani
(Chardon, Ohio)
good post Nadia =) hope you have a great spring break and I like the detail you put into your post especially when your described how to put things into your calculator...even though I don't get any of it =Þ bye bye
ReplyDelete---Aichelle.