Wednesday, March 28, 2007

Developing Expert Voices - Invitation to the Blog

As promised, I built a unique blog for your Developing Expert Voices projects. Email me and I will send you an invitation to the new blog. When you publish your projects on the DEV blog tag them with the name of your class (Applied Math 40S) and the topics covered by the problems you created.

You can take a sneak peak at the new blog here.

Click that picture ... there's a great article at the other end of that link.

Friday, March 23, 2007

Developing Expert Voices Rubric out of beta v.1.0

This is the final version of the document we built together.


Developing Expert Voices Rubric

The teaching of mathematical concepts is the main focus of this project; so we can teach other people and learn at the same time.

Acheivement Descriptors
Instead of levels 1-4 (lowest to highest) we use these descriptors. They better describe what this project is all about.
Novice: a person who is new to the circumstances, work, etc., in which he or she is placed; a beginner.
Apprentice: to bind to or place with a master craftsman, or the like, for instruction in a trade.
Journeyperson: any experienced, competent but routine worker or performer.
Expert: possessing special skill or knowledge; trained by practice; skillful or skilled.


Acheivement
Mathematical Challenge (25%)
Solutions (55%)
Presentation (20%)
Novice Problems illustrate only an introductory knowledge of the subject. They may be unsolvable or the solutions to the problems are obvious and/or easy to find. They do not demonstrate mastery of the subject matter. One or more solutions contain several errors with insufficient detail to understand what's going on. Explanation does not "flow," may not be in sequential order and does not adequately explain the problem(s). May also have improper mathematical notation. Presentation may or may not include visual or other digital enhancements. Overall, a rather uninspired presentation. Doesn't really stand out. It is clear that the student has invested little effort into planning their presentation.
Apprentice Problems are routine, requiring only modest effort or knowledge. The scope of the problems does not demonstrate the breadth of knowledge the student should have acquired at this stage of their learning. One or more solutions have a few errors but are understandable. Explanation may "flow" well but only vaguely explains one or more problems. Some parts of one or more solutions are difficult to follow. May include improper use of mathematical notation. The presentation style is attractive but doesn't enhance the content; more flashy than functional. It is clear that the student has invested some effort into planning their presentation.
Journeyperson Not all the problems are "routine" in nature. They span an appropriate breadth of material. At least one problem requires careful thought such as consideration of a special case or combines concepts from more than one unit. Showcases the writer's skill in solving routine mathematical problems. All solutions are correct and easy to understand. Very few or no minor errors. Explanation "flows" well and explains the problems step by step. Solution is broken down well and explained in a way that makes it easy to follow. May have minor use of improper mathematical notation. May point out other ways of solving one or more problems as well. The presentation may use multiple media tools. The presentation style is attractive and maintains interest. Some of the underlying message may be lost by some aspects that are more flashy than functional. It is clear that the student has given some forethought and planning to their presentation.
Expert Problems span more than one unit worth of material. All problems are non-routine. Every problem includes content from at least two different units. Problems created demonstrate mastery of the subject matter. Showcases the writer's skill in solving challenging mathematical problems. All solutions correct, understandable and highly detailed. No errors. Explanation "flows" well, explains the problems thoroughly and points out other ways of solving at least two of them. The presentation displays use of multiple media tools. The presentation style grabs the viewer's or reader's attention and compliments the content in a way aids understanding and maintains interest. An "eye opening" display from which it is evident that the student invested significant effort.


Creativity (up to 5% bonus)

The maximum possible mark for this assignment is 105%. You can earn up to 5% bonus marks for being creative in the way you approach this assignment. This is not a rigidly defined category and is open to interpretation. You can earn this bonus if your work can be described in one or more of these ways:

  • unique and creative way of sharing student's expertise, not something you'd usually think of;
  • work as a whole makes unexpected connections to real world applications;
  • original and expressive;
  • imaginative;
  • fresh and unusual;
  • a truly original approach; presentation method is unique, presented in a way no one would expect, e.g. song, movie, etc.


Thursday, March 22, 2007

Today's Slides: March 22

Here they are ...


To see a larger image of the slides go here. When you get there you'll see a button in the bottom right-hand corner that says [full]. Click it and the slides will display in full screen mode.

STATISTICS

Hey everyone, i thought i would try something new and make all the slides into flickr's and you know what it was kinda fun. So I'm done all the hot spots for all the slides but now I'm trying too group them and make is to a slide show like our slide share that Mr.K does, but some reason it ain't working for me. So me and Mr.K thought for now your can click on the slides below and it will link you to my flickr's. Well have FUN.

Slide 1
Slide 2
Slide 3
Slide 4
Slide 5
Slide 6
Slide 7
Slide 8
Slide 9
Slide 10

SPRING BREAK IS ALL OVER. WOW time to Smarten Up cause Graduation is coming around the corner. REMEMBER SISYPHUS!

next scribe will be...
Chris

Wednesday, March 21, 2007

Statistics

So, today we started off with a surprise quiz. How do you guys think you did? I decided to do the questions on the quiz we did. Well anyway, here's my scribe post.

1. A) Calculate the mean length and the standard deviation.

We found this one our calculator, by entering all our data (the 52 arrowheads) into our L1 by hitting [STAT] [1/Edit] and pinching in all 52 numbers under the L1 column. Don't forget to check your numbers just incase your numbers don't match the data. After that you hit [2nd] [QUIT] so you get back to the home screen. To get these stats you hit [2nd] [Vars] to get into your distribution menu. Then you hit [1] to get your 1-vars stats then hit [2nd] [L1] [Enter]. Your x bar is 25.44 and your σ is 5.62.

B) Determine the lengths of arrowheads one standard deviation below and one standard deviation above the mean?

In order to determine then lengths of arrowheads within 1σ below and above the mean you have to add and subtract µ from σ.

µ - σ = 19.82 (1σ below)

µ + σ = 31.06 (1σ above)

We have to find, how many arrowheads are between 20 abnd 31.

C) How many arrowheads are within one standard deviation of the mean?

In order to find how many arrowheads are between 20 and 31 you have to count how many arrowheads lie between those two numbers.

52 - 15 (the number of arrowheads that don't lie between 20 and 31) = 37.

D) What percent of the arrowheads are within one standard deviation of the mean length?

37/52 =0.7115 = 71.15%

The next question we've done before, but here's another recap..

2. A) A car designer designs car seats to fit women taller than 159.0 cm. What is the z-score of a woman who is 159.0 cm tall?

This is the formula to find the z-score. z = z-score, x = the value, µ = mean and σ = standard deviation.


159 is the value, 161.5 is the mean and 6.3 is the standard deviation.

-0.3968 is the z-score.

B) The manufacturer designs the seats to fit women with a maximum z-score of 2.8. How tall is a woman with a z-sccore of 2.8?

(z)(σ) + µ = x (this is the equation that Mr. K gave us)

To get this equation, you take the z-score equation and instead of having z by it's self, you get x by itself.

To do this, you take σ and multiply it by z, and then you take µ and move it to the other side which becomes positive, and then you get the equation (z)(σ) + µ = x.

Then you plug in the numbers into the equation:

(2.8)(6.3) + 161.5 = x

179.14 = x

Well this is the end of my scribe. Sorry it took so long. The next scribe is.. just_in.

Today's Slides and Homework: March 21

Here they are ...


To see a larger image of the slides go here. When you get there you'll see a button in the bottom right-hand corner that says [full]. Click it and the slides will display in full screen mode.

Homework is published on the previous set of slides.

Tuesday, March 20, 2007

Statistics scribe

Ok so today was especially difficult for me, and possibly a few others. We mostly about z-scores and how to find them in many ways.
The first question we were asked to work on was this one.

The following information concerning grades is posted on the bulletin board.


Test Grade 55 65 75 85 95
Z-Score -2 -1 0 1 2


We were then asked to find the average. There were a number of ways people found it. But I will show you how I found it.


55+65+75+85+95
<- - - - - - - - - - - - I added all the grades together
5 <- - - then divded by the number of grades i added ( which was 5)
=75 < - - - - - - - - - - - -- -- - - - - - and thats how i got 75.


We then were asked which test score had a z-score of -2.76


this means which test score is -2.76 z-score from the standard deviation. The standard deviation is 75.

One way we found it ( which is completely correct )
was


-2.76=x-75 -2.76 is the z-score x is what we want


10 75 is the mean and 10 is the standard deviation
x=75-2.76(10)
=47.4


Now even though that was right. It is long and messy. So mr.k taught us a faster and more efficiant way of solving the problem which is the same thing but skipping 2 of those steps.


X=75-2.76(10)
=75-27.6
=47.4


x is what we want to find
75 is the mean
-2.76 is the zscore
10 is the standard deviation


we want to multiply the z-score we have by the standard deviation which tells us how many grades the grade we are looking for is from the mean. then subtract ( becuase the zscore was a negative number, if it were positive then we'd add) it from the mean, which will give us a score of 47.4

Our next question we were given two people, Tammy and Jamey who both applied for a job. Tammy scores 80 on her provinicial exam and the mean was 70 with a standard deviation of 4.2. Jamey score 510 on her company exam with a mean of 490 and a standard deviation of 10.3. We are to immagine that the company takes these two different exams and make them the same to figure out which one did the best. Who might get the job.

So we firgured out both girls z-scores


tammy jamey
M=70 mean 490
o=4.2 standard deviation 10.3
n=80 her score 510


80-70 510-490
4.2 10.3
=2.83 1.94


We chose Tammy because tammy's z-score was larger. This meant that she was 2.83 standard deviations ABOVE the AVERAGE of the group, where as even though jamey's test score was much HIGHER then tammy's she was only 1.94 ABOVE the average, makeing her average smaller then tammy's
Next we were asked to punch in alot of numbers in to our List1


After we placed all those numbers in our L1
we did this on our calculators

[place picture .c here]

then to draw a histogram on our calculators. If you remember we we to our plots in our calculators andturned it on then chose historgrams. The made sure our xlist was L1 and placed our frequency at 1
To do this we


Then we change our window settings to


Xmin=-6
Xmax=73
Xscl=7.4
Ymin=-10
Ymax=30
Yscl=5
Xres=1

With that we should get a graph like so


Then we were asked if it was normally distubted and we looked at the numbers that we stored.
To figure this out we looked back at the set of numbers we punched into our L1
we also looked at what we stored in S and M, which were the Mean and the standard deviation. If you remembered they were
the M = 49.06
and
the S = 7.3929

The red circled numbers are the numbers within the first deviation of the mean. We found these numbers using what we stored. Remember we stored the MEAN of the numbers we punched in and the STANDARD DEVIATION.

To find -1 of the MEAN we subtracted the S from the M like this

x-o=49.06-7.39
=41.67

then we found the +1 of the MEAN adding S to M.
x+o=49.06+7.34
=56.45

When we counted the red circles up we found 39 numbers within one deviation of the mean. That is 39 numbers our of 50 which means there are 78% of the numbers that are within the first deviation of the Mean. We decided that this was not normally distributed because the normal distribution of data within one deviation of the mean is about 68%.


The red circled.

Ok lets end it with a Mr.K joke ( for those of you who missed it! )


Whats round on the outside and high in the middle?


OHIO... OH! ahahah get it...! OHIO... great joke Mr.K

unfotunately I've run out of time so i cannot finish the second half of the classes scribe till tomarrow afternoon. But if you were wondering who the next scribe is for tomarrow its iss......... TENNYSON
( i am having a bit of problems with the spell check so ... sorry about that )

Today's Slides and Homework: March 20

Here they are ...


To see a larger image of the slides go here. When you get there you'll see a button in the bottom right-hand corner that says [full]. Click it and the slides will display in full screen mode.

And here is your homework (14 questions) ...


Lessons from the geese?


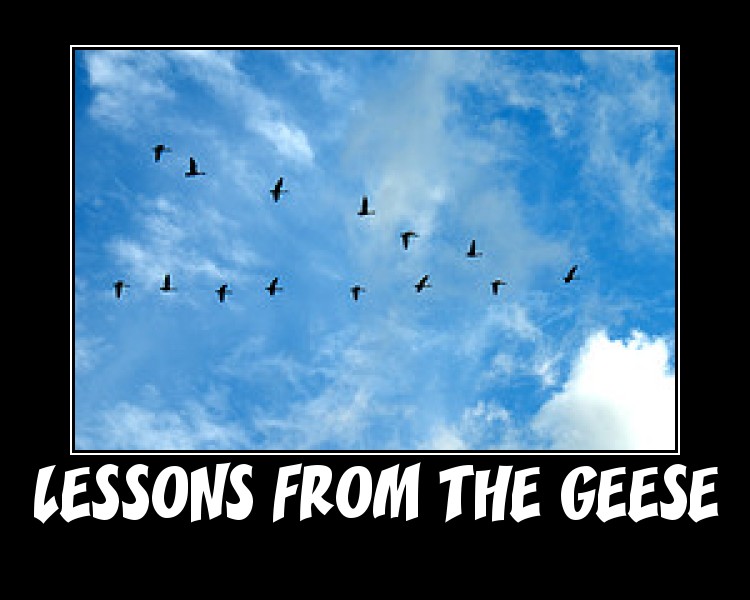
The geese who inhabit the wildlife preserve where we walk each day are back; not many, but a few as the ice begins to melt. I wonder if you see them yet, returning for spring flying along in "V" formation? Do you know what science has discovered as to why they fly that way?

FACT 1 - As each Goose flaps its wings it creates uplift for the birds that follow. By flying in a V formation, the whole flock adds 71 per cent greater flying range than if each bird flew alone.

FACT 2 - When a Goose falls out of formation, it suddenly feels the drag and resistance of flying alone. It quickly moves back into formation to take advantage of the lifting power of the bird immediately in front of it.

FACT 3 - When the lead Goose tires, it rotates back into the formation and another Goose flies to the point position.

FACT 4 - The Geese flying in formation honk to encourage those up front to keep up their speed.

FACT 5 - When a Goose gets sick, wounded or shot down, two Geese drop out of formation and follow it down to help and protect it. They stay with it until it dies or is able to fly again. Then, they launch out with another formation or catch up with the flock.

Are there lessons we can learn from a gaggle of geese? What do you think?

Monday, March 19, 2007

March 19, 2007

I hope you guys enjoy this! It was fun. hehe ^_____^


And the next scribe is...... NADIYA!

Today's Slides and Homework: March 19

Here they are ...


To see a larger image of the slides go here. When you get there you'll see a button in the bottom right-hand corner that says [full]. Click it and the slides will display in full screen mode.

Sunday, March 18, 2007

Scribe (March.16/07)

Hello Ladies and Gentlemen this is the scribe post for Friday, March 16/07. Sorry It wasn't posted until today but I had a concert last night PCD and Christina A, which was if I may add amazing but anywaise.
Here we go...


Morning class:
**We started off with doing the "lets warm up" slide.

Part 1 (Slide 1&2)
In the Black Box--->For the calculations of the "mean" and "standard deviation" we don't use the first column in the table because it's a "range" therefore you do not know the exact number, and we use "1-VARS Stats" on our calculators.

In the Purple box---> We are looking for the number of students that have marks WITHIN the standard deviation. Within is a key word because that can mean -1 standard diviation or +1 standard deviation. So we calculate the mean + standard deviation as well as the mean - the standard deviation.

* The blue lettering means that # of students that fall in the red and green part.*

The last part---> We added the blue circled part in teh table and divided it by the numeber of students in total.

Part 2 (Slide 3)
Calculator functions for this side are:
1. Go into lists [ STAT, option 1]
2. In List 1 (L1) put in the marks. [33,42,51,60,69,78,87,96]
3. In List 2 (L2) put in number of students. [1,4,12,18,24,16,7,3]
4. Exit the screen [2nd MODE]
5. STAT > to option one "1-Var Stats" then ENTER
6. Then press 2ND #1 then the comma (,) 2ND #2 then ENTER
7.Press 2ND Y= to stat plots then press ENTER turn state plot "ON" Key down, make sure the "type" is a Histogram.
8. In "Xlist" make sure L1 is there9. In "FREQ" make sure it's L2
10. Adjust Window settings.
x-min= 29 [ Because it's the lowest mark a student can have in the table]
x-max=101 [Because we have to include the possibility of a student getting 100% on a test]
xscl=9 [Because thats the number of numbers inbetween each range]
ymin= -10 [Because we need to see all values once graphed]
ymax= 30 [Because there are 24, and you ant to show that changes at the top of the screen]
Yscl= 5
Xres=1
11. Press GRAPH

** Next we went onto dictionary slides (slide # 4-# 7)
We looked at "Standard Normal Curve"
The numbers on the bottom of the curve is the standard deviation.
1.000 is one standard deviation above the "mean" which is 0.000
-1.000 is one standard deviation below the "mean which is 0.000

Also at the this point Mr.k mentioned an interesting fact although it has nothign to do with this topis but...
Did you know that IQ test do not really measure your intelligence?

Anyway....
Bell-shaped Curve
-Most things fall one standard deviation of the mean.

*REMINDER*
When you know the standard deviation and the mean you know the spread of how much of the mean is in each standard deviation.

Definitions:
-ZScore: Which tells how many standard deviations you are from the mean.
(Beth and Burt example)

-Six Sigma: Example most companie can't satisfiy all their customers but they try to satisfy six sigma or 99% of them, it all related back to statitics.

* The 68-95-99 rule basically describes all*
(refer to slide # 7)

Afternoon
We applied the information we learned in the morning class to real questions.

Slide #8 Questions we reffered back to the Bell shaped Curve as shown in a picture above.

a.) 358---> zscore is 2 standard deviations away from the mean
352---> z score is -4

Next we as a class put together a formula together sort of that would help us solve question b.
Next we moved onto some more questions.


Well that's all for me enjoy the rest of your weekend
Bye bye
-Brittany<3>
PS. The next scribe is ummmmm Jenn

Saturday, March 17, 2007

Flickr Assignment Rubric v1.0

Flickr Assignment Rubric
It is paramount that the picture be in tune with the purpose of the assignment. It should show, first of all, the student's understanding of how the photo is related to mathematics. The hot spots are important too, because that's essentially your way of teaching other people. Creativity is a factor, because keeping one's interest in the photo contributes to the learning process. Finally, the picture quality should be kept in mind too. If we can't see the picture, it's going to be hard achieving all the other requirements.

Tags

The picture must be tagged properly with the course tag and assignment tag. If tags are misspelled or no tags are present the photo cannot be graded and will receive a grade of ZERO. Not tagging your photo properly and accurately is analogous to not handing in your work or not putting your name on it.


Classification
Mathematical Content (50%) Hot Spots (35%) Photograph (15%)
Level 4
Packed with mathematical concepts/facts. (Minimum 7 concepts/facts.) All hot spots accessible; i.e. "smaller" hot spots are "on top" of larger ones, they do not obscure each other. All hot spots are actually labels and relate to parts of the photo (not on blank space with filled in notes). One or more hot spots include a link to a relevant supporting resource on the internet. Minimum 7 hot spots. In focus or appropriately focused for effect. The subject of the picture occurs "naturally," it is not a contrived shot. Really makes the viewer "see" math in a place they hadn't realized it existed. (Example: trigonometry)
Level 3
Significant number of concepts/facts included. (Minimum 5 concepts/facts.) All hot spots accessible. Most hot spots are actually labels and relate to parts of the photo. Not more than one hot spot on blank space. One or more hot spots may include a link to a relevant supporting resource on the internet. Minimum 5 hot spots. In focus or appropriately focused for effect. The subject of the photo has been "set up" or contrived yet still illustrates math found in "the real world." (Example: derivative)
Level 2
Some effort to include content evident. (Minimum 3 concepts/facts.) Most hot spots accessible. Most hot spots are actually labels and relate to parts of the photo. More than one hot spot is on "blank" space. May or may not include links to relevant supporting resource on the internet. Minimum 3 hot spots. In focus or appropriately focused for effect. Although it is a "real world" picture, objects have been used to "draw" the math. An obviously contrived shot. (Example: trigonometry)
Level 1
Very scarce content related to assignment. Less than three hot spots are visible or have information related to the theme of the assignment. It is evident that little effort went into finding and shooting a picture that reflects the theme of the assignment.
Level 0
Content unrelated to theme of assignment. No hot spots or mostly unrelated to the theme of the assignment. Out of focus and/or otherwise difficult to look at.

Creativity (up to 5% bonus)

The maximum possible mark for this assignment is 105%. You can earn up to 5% bonus marks for being creative in the way you approach this assignment. This is not a rigidly defined category and is open to interpretation. You can earn this bonus if your work can be described in one or more of these ways:

  • unique and creative way of looking at the world, not something you'd usually think of;
  • original and expressive;
  • imaginative;
  • fresh and unusual;
  • a truly original approach.


Friday, March 16, 2007

Today's Slides: March 16

Here they are ...


To see a larger image of the slides go here. When you get there you'll see a button in the bottom right-hand corner that says [full]. Click it and the slides will display in full screen mode.

Thursday, March 15, 2007

Today's Slides and Homework: March 15

Here they are ...


To see a larger image of the slides go here. When you get there you'll see a button in the bottom right-hand corner that says [full]. Click it and the slides will display in full screen mode.

And here is your homework (7 exercises) ...


Statistics; March 15, 2007

This is what we have learned in Applied Mathematics 40s March 15, 2007.

The class wants Mr. K to review or explain what we have learned yesterday March 14, 2007, because we didn't get it at first; well statistics is pretty confusing. Right after that conversation Mr. K showed us his yesterday's example.

Mr. K, re-explaining about the MEAN, MEDIAN, MODE, RANGE & STANDARD DEVIATION:

Mean: Remember that mean is the "average" for the total data we calculate.
To Calculate the Mean without a calculator.
" You add up all the the numbers and divide the answer by how many numbers you have on your data"

For Example:

Data: 1, 2, 3, 4, 5, 6, 7, 8, 9, 10

1+2+3+4+5+6+7+8+9+10 = 55

55 / 10 = 5.5

So the Mean is 5.5

Median: The median in exactly in the middle.

For Example:

Data: I, 2, 3, 4, 5

1, 2, 3, 4, 5

So 3 is the Median.

Mode: The mode is the often numbers you see on your data.

For Example:

Data: 1, 2, 2, 2, 2, 3, 4, 5

So 2 is the Mode.

Range: The range is the difference between the biggest number and the smallest number on your set of data.

For Example:

Data: 1, 3, 5, 7, 8, 13

13 - 1 = 12

So 12 is the Range.

Standard deviation:

SORRY....I'll do improvements later...


THE NEXT SCRIBE WILL BE........."BRITT"

Wednesday, March 14, 2007

Today's Slides: March 14

Here they are ...


To see a larger image of the slides go here. When you get there you'll see a button in the bottom right-hand corner that says [full]. Click it and the slides will display in full screen mode.

March 14, 2007

Happy Pi Day to everyone. To start things off, here some facts about Pi Day.


March 14, written as 3-14 or 3/14 in the United States date format, represents the common three-digit approximation for the number π: 3.14. Pi Day is often celebrated at 1:59 p.m. in recognition of the six-digit approximation: 3.14159. Some, using a 24-hour clock, celebrate it at 1:59 a.m. or 3:09 p.m. (15:09) instead.

Pies for a celebration at the Massachusetts Institute of Technology
Pi Day is celebrated in a variety of ways. Parties or other observances may be held by
mathematics departments in educational institutions. Harvard's Math department, for instance, has a pi recitation contest as well as a pi eating contest. Mathematics or science clubs might gather to consider the role that the number π has played in their lives and to imagine the world without π. During such an event, pi celebrants may approximate π, devise alternative values for π, eat pie, play piñata, drink Piña Colada, eat pizza, listen to the song "Pi" by Kate Bush, watch Pi, or recite Pi. The song 867-5309/Jenny is sometimes sung, replacing the digits with the first several digits of pi. The shape of the pie is sometimes square, due to the pronunciation of the equation for the surface area bounded by a circle = πr2, i.e., "pie are squared."


It's unclear when Pi Day was first celebrated. The Exploratorium began an annual public celebration of Pi Day in 1987, with staff and public marching around one of its circular spaces, and then consuming fruit pies; the museum has since added pizza pies to its Pi Day menu.
Enthusiasts also note that the day happens to be
Albert Einstein's birthday, among other famous birthdays on this day. Massachusetts Institute of Technology, known for its sometimes unconventional and quirky take on mathematics, often mails out its acceptance letters to be delivered to prospective students on Pi Day.


Wikipedia.


We started our morning class by celebrating Pi Day. I felt bad on eating all those pies that I ate because I did not bring any. Anyways, besides eating lots of pies and drinking milk/chocolate milk, Mr. K also told us about the rubric for the "Developing Expert Voices" and "FlickR" assignments.

*Rubric is basically a method and tool for grading assignments


In our afternoon class, we discussed Measures of Variability. We talked about Range, Mean, Standard Deviation, etc.


Range - the difference between the largest and smallest value in a set of data.

Mean - the sum of the observations divided by the number of observations.

Standard Deviation - measures how widely spread the values in a data set are.


We started the last period by listing everyone's age on the smart board.
These are the results:

highest value: 19
lowest value: 16
Range: 3 (19-16)


Then we calculate the data using this procedures:


*press STAT, 1. EDIT, the put the values on list one.
*after putting all the values, press 2ND, MODE to quit.
*press STAT, →, 1. VARS STAT.
*press 2ND, 1 to calculate the values on list one.


We get the values: Mean() = 17.6875
Standardard Deviation(σ) = .9823


If the Mean Average is 17.6875 and the Standard Deviation is equal to .9823, it means that our age difference is not too far from each other.
Mr. K also introduced to us the Standard Deviation Formula.


WHERE:
x = individual score
μ = population mean
n = number of scores
Σ = means "the sum of"
That's all for me folks. Happy Pi Day, again.
the next scribe is Ivy


Developing Expert Voices


The Assignment
Think back on all the things you have learned so far this semester and create (not copy) four problems that are representative of what you have learned. Provide annotated solutions to the problems; they should be annotated well enough for an interested learner to understand and learn from you. Your problems should demonstrate the upper limit of your understanding of the concepts. (I expect more complex problems from a student with a sophisticated understanding than from a student with just a basic grasp of concepts.) You must also include a brief summary reflection (250 words max) on this process and also a comment on what you have learned so far.

Timeline
You will choose your own due date based on your personal schedule and working habits. The absolute final deadline is May 31, 2007. You shouldn't really choose this date. On the sidebar of the blog is our class Google Calendar. You will choose your deadline and we will add it to the calendar in class. Once the deadline is chosen it is final. You may make it earlier but not later.

Format
Your work must be published as an online presentation. You may do so in any format that you wish using any digital tool(s) that you wish. It may be as simple as an extended scribe post, it may be a video uploaded to YouTube or Google Video, it may be a SlideShare or BubbleShare presentation or even a podcast. The sky is the limit with this. You can find a list of free online tools you can use here (a wiki put together by Mr. Harbeck and myself specifically for this purpose). Feel free to mix and match the tools to create something original if you like.

Summary
So, when you are done your presentation should contain:
(a) 4 problems you created. Concepts included should span the content of at least one full unit. The idea is for this to be a mathematical sampler of your expertise in mathematics.

(b) Each problem must include a solution with a detailed annotation. The annotation should be written so that an interested learner can learn from you. This is where you take on the role of teacher.

(c) At the end write a brief reflection that includes comments on:

• Why did you choose the concepts you did to create your problem set?
• How do these problems provide an overview of your best mathematical understanding of what you have learned so far?
• Did you learn anything from this assignment? Was it educationally valuable to you? (Be honest with this. If you got nothing out of this assignment then say that, but be specific about what you didn't like and offer a suggestion to improve it in the future.)

Experts always look back at where they have been to improve in the future.

(d) Your presentation must be published online in any format of your choosing on the Developing Expert Voices blog. url: tba.
Experts are recognized not just for what they know but for how they demonstrate their expertise in a public forum.

Levels of Achievement
Instead of levels 1-4 (lowest to highest) we will use these descriptors. They better describe what this project is all about.

Novice: A person who is new to the circumstances, work, etc., in which he or she is placed.

Apprentice: To work for an expert to learn a skill or trade.

Journeyperson: Any experienced, competent but routine worker or performer.

Expert: Possessing special skill or knowledge; trained by practice; skillful and skilled.

Monday, March 12, 2007

BOB

When this unit is pretty hard. I think this unit is the most diffcult of them all. You just have to do all of question to test your self. Remeber what Mr.K said Math is a science of patterns. Well thats all i have to say for blogger to blogger, back to studying. by3
from tennyson

BOB

Well the Probability test is tomorrow, yes tomorrow. This unit was hard to grasp for me, for some reason I just couldn't wrap my head around it. It was weird because in class I would be confused and then we would talk about it as a class and I completely understood it, but once I got home for some reason I once againw as confused. My problem I think was doing the first step, just getting to that point because once I got through that I was normally okay. My favorite part was probably the tree diagrams I kinda like those. Over all this unit was not one I excelled in, but hopefully I will do well on the test. Good luck guys!
-Brittany<3

Monday, March 12

Hello Guyz!.. In today’s class during the morning period we submitted our individual deadlines for our project (DEVELOPING EXPERT VOICES) and after that we started discussing about the new unit called STATISTICS. Statistics is the branch of mathematics that deals with the collection, organization, and interpretation of data. You noticed that our previous unit Probability has a connection to our new unit Statistics. These concepts will be combine to work with the Probability Distributions where the probability distributions gives the theoretical probability of each outcome of an experiment…

Then in the afternoon class we did an experiment where Mr. K gave us 4 coins and we toss it 12x and some toss it 13x to be a total of 200 trials, these experiments tells us the probability of having 4 all girls in a family.

THEORETICAL PROBABILITY

Having 0 girls --- P(0G) = 4! (1/2)^4 = 1 = 6.25%
4! 16
Having 1 girl -----P(1G) = 4! (1/2)(1/2)^3 = 4 = 25%
3! 16
Having 2 girls ----P(2G) = 4! (1/2)^2(1/2)^2 = 6 = 37.5%
(2!2!) 16
Having 3 girls ----P(3G) = 4! (1/2)^3(1/2) = 4 = 25%
3! 16
Having 4 girls ----P(4G) = 4! (1/2)^4 = 1 = 6.25%
4! 16


EXPERIMENTAL PROBABILITY

# Of Girls
0 = 18 18 = 9%
200
1 = 51 51 = 25.5%
200
2 = 69 69 = 34.5%
200
3 = 54 54 = 27%
200
4 = 10 10 = 5%
200

a total of 200 trials

We did this experiment 200x for our experimental probability to be close to our theoretical probability. Then we graph it to our calculator so we could see the difference of each one... just refer to the slide for the graph....
I gues thats it for me... and the next scribe will be cRiS_J

GuDLuCk oN tOmOrrOw's tEsT....

Today's Slides: March 12

Here they are ...


To see a larger image of the slides go here. When you get there you'll see a button in the bottom right-hand corner that says [full]. Click it and the slides will display in full screen mode.

Sunday, March 11, 2007

Friday, March 9

Hey everyone, in our Friday's class, we started out with a 20 minutes pre-test for our upcoming Probability Test on Tuesday.
After the pre-test, the class was separated into 4 groups for us to share and discuss our answers to our group members.
Then we were asked to hand in one test paper per group with all the group members name on it.
Right after that, Mr.K. showed us the correct answers on the Smart Board.

Here is one of the questions we had on our test:

5 a...


and here is 5 b,c, and d...


To see the four other questions we did, please refer to the slides from March 9.
That's it for me... the next scribe is... jOweLL

Friday, March 9, 2007

Today's Slides: March 9

Here they are ...


To see a larger image of the slides go here. When you get there you'll see a button in the bottom right-hand corner that says [full]. Click it and the slides will display in full screen mode.

Thursday, March 8, 2007

Proability Review

Hey everyone its tennyson in the house.Ok left just start by talking about what we did during class.

In the morning we didn't do much,Mr.K was explaining the assignment that we had to due.Which was :
-4 math questions (can be anything that we learned)
-answer & explain solution.

This project has a flexable and resting time for the due date. It can be done anytime.But be smart about it because testes and exam can get in the way, so it's better to be done earlier.

also this project can be done in any unique way.We were talking about using audio,slides,screen videos,and more.....

In the afternoon, we got into practicing questions in groups.

here are the questions:
Design an experiment using the random number function of your calculator to determine the probability of passing a six- question multiple choice test if you guess all the answers. Each question has four answers,and one answer is correct in each case.How many simulations would seem reasonable? What is the experimental proability of getting at least 50% on the test?

That is our first solution:


That is our second solution:


The different answers we got in class:


One more thing remeber this question is asking for the "expermental prob."
answer what it askes you ,not what it doesn't ask.
The last question that we did is:
As your birthday approaches you are looking for ways to make money so you can buy a used car.Currently you earn $10 a week for doing chores around the house.

Your parents realize that you are trying to save up,and offer you the following deal. You can either be paid the $10, or you can pull two bills, and a $10 bill. For example, you might pull out a $1 bill followed by $5 bill,and earn only $6. Or you might pull out the $10 bill followed by a $5 bill and earn $15.
If you were given this option every week, what would be better for you to do i nthe long run? Is pulling tow bills from the paper bag a great way to make money? Be sure to give complete explanation of how you found your answer.

Here is the answer

If Calculate the total for the bag it in 10 weeks is $82
the total for $10 in 10 weeks is 100.
you're better off with $10
Well thats it guyz by3

NExt scribe is Al Andrei

BOB

Were almost done probability! this is the hardest unit ever. i rememeber someone saying they wanted to skip this unit because it was easy. they're crazy. i dont know if im prepared to do the test. i still don't really get it. but tomorrow we'll be doing our pre-test so it'll give me a sense of whats going to actually be on the test. i still have to practise on the nCr and nPr because those are the ones im really having trouble on. im so releived that our test is on monday! so i can study alot during the weekend.

Today's Slides: March 8

Here they are ...


To see a larger image of the slides go here. When you get there you'll see a button in the bottom right-hand corner that says [full]. Click it and the slides will display in full screen mode.

BOB

We are finally coming to an end with this Probability Unit and still i don't know much, its every hard to understand, but with reviewing all the practice we had done and all the notes that we have taken i think it will help a lot. Sometimes I know what Mr. K is talking about, and other times i don't, guess it's all the steps and all the ways you can look at the problem. Its a lot to remember like braking the problem and doing them in step so it can help, and the make the right choices in which probability solution to use. For example...if it is a theoretical, experimental, binomial experimental probability, permutations, combinations....just lots to remember. But besides all that, its kinda fun to do.

Wednesday, March 7, 2007

BOB

Wow we're almost done on our Probability unit.. This unit is a lot harder than on our previous unit Matrices and confusing too....Actually its not really that hard its just the questions that confuses me... But I understand it now but still confuse on some questions.... Oh well I'll just have to study hard on it so that I could just get at least 50% on the test...... >:)

BOB, Probability

Now probability unit is ending up. I actually understand it now, but I need a little more thinking about the questions so I can solve it. I also need questionnaires to practice on my self maybe, the review questions in our text book will do. It really confuses me sometimes about the questions, because it twists' my brains. I really need to review just in order for me to get at least 50 percent oh well. I will try and squish my brains, and that's it.

BOB

We are almost done in our probability unit, but Mr. K thinks that we are not ready, yet for the upcoming test. I think this is one of the hardest unit that I have ever taken. In this unit, Mr. K introduced few formulas that we can use. He said that in this unit we can't just rely on formulas to solve this problems. He said that we should not have a mechanical thinking on any of the problems. He said that we should learn how to understand what each number represents in the question, not just putting them all in the formula. Well, there are still a lot of things involved in this unit, but I think this is one of the most important thing we have to remember to do well on the test. I hope our next unit will be a lot easier than this one.

Wednesday, March 7

Today's class we were broken into groups and told to solve a couple of problems. The first problem was this...

1. An examination consists of 13 questions. A student must answer one of the first two questions and only nine of the remaining ones. How many choices of questions does the student have?

Many of us had different answer but all were wrong lol but they were all right in their own way.
Had the question been a pick question the answer 1+11! would of been close to being right. If it asked for probability the answer of 1/2 x 9/11 = 9/22 would of been on the right track. Now 13 was right in the sense that yes they are 13 questions to choose from.

Now because the question asks how many choices does the student have? The formula that should be used to answer this question would be the choose formula.

~Your first step would be to punch in 2 nCr 1 into your calculator. This is because in part A the student has to answer one out of two questions. The answer you should get is 2.

~Your second step would to punch in 11 nCr 9 into your calculator. Because in part B you have 11 possible questions left that can be answer but you only have to answer nine of them. The answer you should get is 55.

~ Finally you take 2 x 55 which will give you 110 as your finally answer.

Things to remember.

1. Factorial notation (!) is used when using the pick formula. Ex. How many books can be arranged on a book shelf? So you would go 12! to get your answer.

2. On any tests or the exam if you are given a choose question, and you write your answer for example as 11 nCr 9 it will be marked WRONG your answers should be written as 11 C 9

The next question we were given was...

Randomly arranged on a bookshelf are five thick books, 4 medium sized books and, 3 thin books. What is the probability that the books of the same size stay together?

The way we did this in class was we broke the questions into 3 parts.


1. How many ways can the 12 books be rearranged on the bookshelf?

while because we don't care what order they are in all you need to do is go 12!.

so 12! gives you 479 001 600.

2. How many ways will the books of the same size stay together.

There are 3 sizes of books, so say you put each book of the same size into a different bag. Now you only have 3 object to rearrange. With this your answer is 3! but now if you open bag one just rearrange the books by themselves you get 5! because there are 5 thick books. Bag two would give you 4! because there are four medium-sized books and bag three would be 3! because there are three thin books.

so with this you take 3! x 5! x 4! x 3! = 103 680

3. What is the probability of the books of the same size stay together?

You already have your fraction so the question is pretty much done, you take

(3! x 5! x 4! x 3!) / 12!

Sorry for the way the fractions are written i couldn't figure out how to do the normal line.

The next scribe is Tennyson

Today's Slides: March 7

Here they are ...


To see a larger image of the slides go here. When you get there you'll see a button in the bottom right-hand corner that says [full]. Click it and the slides will display in full screen mode.

BOB

When Mr. k told us that the next unit was going to be on Probabilities, I was like "OH MAN".... I knew that this unit was going to be hard. I didn't really get this unit right away. I had trouble with the equations used to solve problems. I didn't which one was the one for a particular question. The questions were also kind of hard to understand sometimes. It almost seems like its a tricky question. Today's class cleared the blurr in my head. I can now use the right equations to solve problems, thanks group2!!. The people in my group help me understand the problems I had, now only if i can go back in time to when we had the quiz. Other people wrote that the pre-test will help them on the test on Thursday, well..same goes for me. Good luck!!...Oh yeah..anyone know our next unit...

Tuesday, March 6, 2007

PROBABILITY and Pi"e"


Today was the last day of our second unit, Probability. In the beginning of class, Mr. K reminded us about Pi Day which is on March 14. This lead to discussing about the party on that day. PARTY!!!!!. Everyone is then going to bring their own pies to share to the whole class....oh...and milk.


Later on, we continued our questions and we left off yesterday. Here are the reviews with some explanations
question: The probabilty that Tony will move to Winnipeg is 2/9, and the probability he will marry Angelina if he moves to Winnipeg is 9/20. The probability that he will marry Angelina if he does not move to Winnipeg is 1/20. Draw a tree diagramm to show all outcomes.


That is how we can construct a diagram with information from the question.

the next question is...


=What is the probability that Tony will move to winnipeg and marry Angelina.


Bob (probablity)

After the Matrices unit was over i knew the next unit was only going to be harder and i was right. Not only was the probability unit harder it was also more confusing and at times i had no idea what i was doing. We also learned many different formulas used to solve probability questions, the only problem with that was it was a little hard knowing which formula to use for which type of question. I would also have to agree with Al when he said that the smart board helps him, well it has also been a big help for me because if we dont get something in class we can always look at the slides when we get home. I think am ready for the test but the pre-test tomorrow will help me out a bit.

BOB

As I expected, this Probability unit is alot harder than our first unit, Matrices, and alot more confusing. When we were given a question, it was hard to think of ways or solutions to answer them. It was hard to choose which of the different solutions we learned do we have to use to come up with an answer for a certain question or event. I think that the Smart Board really helps my understanding of what we are doing, not only that we could write our solutions on it, but also Mr. K could publish everything we wrote on it into our site, and we could review them at home.
I'm still not sure if I am ready for the test, but our pre-test tommorow will give me an idea on what to expect on the real test. ~(_8(])

BOB

Well, our test is coming up soon. Probability... I never really liked that unit, even when I was in elementary! But anyways, when we started probability I had no clue of what I was doing. I started to catch on when we took things a little slowly. Then we went all fast again! Then I was lost. But we're doing a lot of questions, and I feel like I'm learning from that. Well I hope I am =) The only thing that scares me and I feel like I really need more time on is the Mutually Exclusive events. And I still have troubles learning how to approach certain questions. But I'll study hard, and LOOK OVER ALL MY NOTES! And I'll study off of our blog. I'm pretty sure it'll help. OKAY BYE!

BOB

Probability, I thought was a scary word. And it was for a while. And even though i still have trouble with it, the diagrams I've been tought to use, like the tree, have really helped alot. I knew before these past few classes that I could use them, but i dont think i was ever really shown how to use them. And that really helped, to be shown to do it and then HAVE to do it in a question. Now the only thing that scares me is that there is alot of work involved. But if things only get harder from here, im kinda not looking forward to movin on. If we could just sit there and work on probability all day I'd be all for it, and thats alot coming from someone with a probability phobia. HEHEHE (>-_-)>

Probability

This unit about probability is harder than the last unit about matrices. At the beginning of the unit, problems are plain and easy, but as we move to different chapters in this unit, we encounter more complicated stuff. The Math dioctionary really helps, knowing what the terms mean. There were probelms that we had in class that were difficult to solve, but I think that I just have to read the question or the problem carefully. Working with groups also helps in understanding the concept of probability, because I can ask the group members if I don't get something, and vice versa. We are having our pre-test tomorrow. I hope I do good in it, so that I know that I can also do good in the soming test. =)