Here we go...
**We started off with doing the "lets warm up" slide.
 Part 1 (Slide 1&2)
In the Black Box--->For the calculations of the "mean" and "standard deviation" we don't use the first column in the table because it's a "range" therefore you do not know the exact number, and we use "1-VARS Stats" on our calculators.
In the Purple box---> We are looking for the number of students that have marks WITHIN the standard deviation. Within is a key word because that can mean -1 standard diviation or +1 standard deviation. So we calculate the mean + standard deviation as well as the mean - the standard deviation.
* The blue lettering means that # of students that fall in the red and green part.*
The last part---> We added the blue circled part in teh table and divided it by the numeber of students in total.
Part 2 (Slide 3)
Calculator functions for this side are:
1. Go into lists [ STAT, option 1]
2. In List 1 (L1) put in the marks. [33,42,51,60,69,78,87,96]
3. In List 2 (L2) put in number of students. [1,4,12,18,24,16,7,3]
4. Exit the screen [2nd MODE]
5. STAT > to option one "1-Var Stats" then ENTER
6. Then press 2ND #1 then the comma (,) 2ND #2 then ENTER
7.Press 2ND Y= to stat plots then press ENTER turn state plot "ON" Key down, make sure the "type" is a Histogram.
8. In "Xlist" make sure L1 is there9. In "FREQ" make sure it's L2
10. Adjust Window settings.
x-min= 29 [ Because it's the lowest mark a student can have in the table]
x-max=101 [Because we have to include the possibility of a student getting 100% on a test]
xscl=9 [Because thats the number of numbers inbetween each range]
ymin= -10 [Because we need to see all values once graphed]
ymax= 30 [Because there are 24, and you ant to show that changes at the top of the screen]
Yscl= 5
Xres=1
11. Press GRAPH
** Next we went onto dictionary slides (slide # 4-# 7)
We looked at "Standard Normal Curve" The numbers on the bottom of the curve is the standard deviation.
1.000 is one standard deviation above the "mean" which is 0.000
-1.000 is one standard deviation below the "mean which is 0.000
Also at the this point Mr.k mentioned an interesting fact although it has nothign to do with this topis but...
Did you know that IQ test do not really measure your intelligence?
Anyway....
Bell-shaped Curve
-Most things fall one standard deviation of the mean.
*REMINDER*
When you know the standard deviation and the mean you know the spread of how much of the mean is in each standard deviation.
Definitions:
-ZScore: Which tells how many standard deviations you are from the mean.
(Beth and Burt example)
-Six Sigma: Example most companie can't satisfiy all their customers but they try to satisfy six sigma or 99% of them, it all related back to statitics.
* The 68-95-99 rule basically describes all*
(refer to slide # 7)
Afternoon
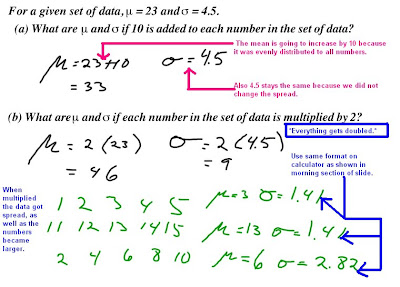
We applied the information we learned in the morning class to real questions.
Slide #8 Questions we reffered back to the Bell shaped Curve as shown in a picture above.
a.) 358---> zscore is 2 standard deviations away from the mean
352---> z score is -4
Next we as a class put together a formula together sort of that would help us solve question b. 
Next we moved onto some more questions.
 Well that's all for me enjoy the rest of your weekend
Bye bye
-Brittany<3>

No comments:
Post a Comment