Well I figured I would BOB about the sequences and the design and measurement "tests". I don't know what it is about Design and measurement but it does not make me nervous, sometimes I do well on it other times I don't. Its pretty easy as long as you know how to find area, perimeter, surface area, etc as well as knowing your metric systems. The only thing I didn't like about the unit is that it was so fast and we never really got a chance to go over much of it as a class until the assessment came about. But it helped!:)
For some reason I understood sequences at the beginning of the unit when we started talking about it lots, but once we got past the the find the nth term I started to get confused. Once that happened I started to question my abilities in the unit I understood it but didn't at the same time I didn't. Maybe because its the end of the year and eberythings getting"CRAZY", with all the different assignments and stress about the provincials. Well we'll see what happens On the provincial I really want to do well.
-Britt <3
Showing posts with label Britt. Show all posts
Showing posts with label Britt. Show all posts
Sunday, June 10, 2007


Tuesday, May 29, 2007
BOB
...Well our unit of Periodic Functions is done, to me it went by extremely fast. It actually was a pretty short unit. I don't know I guess it was ok, but not my favorite. I missed a day of school which just happened to be a double class day which sucked, because when I came back we had one class and then the pretest. I'm not really comfortable with the material, which sucks but I guess I know the basics I like making the equations and I understand the basic graph stuff and mon, max and intersection etc. Hopefully everything comes together and all goes well. Good luck
-Britt<3
-Britt<3
Monday, May 28, 2007
Scribe, May 23,24 and 25
Hello everyone sorry I forgot I was scribe I know bad, this will be the scribe for Wednesday, May 23, Thursday May24 and Friday May 25.
On May 23 and 24 we got two booklets in which we were supposed to work on independently for a new unit of Design and measurement. Basically the whole unit was summarized in these two booklets but Mr.K wasn't there and we had kind of a hard time recalling this methods because it's been so long.
On Friday, when Mr K came back there was really no talk about the unit we had done while he was away. He started off by reviewing what we had done so far in periodic functions ( the slides from the past classes) and reminded us that our exam was only about 19 days away.
In slide 1 we looked at putting all the information we had done so far to a problem.
Sorry I'll finish up later my pictures don't want to work
The next scribe Is........I think were starting a new cycle
On May 23 and 24 we got two booklets in which we were supposed to work on independently for a new unit of Design and measurement. Basically the whole unit was summarized in these two booklets but Mr.K wasn't there and we had kind of a hard time recalling this methods because it's been so long.
On Friday, when Mr K came back there was really no talk about the unit we had done while he was away. He started off by reviewing what we had done so far in periodic functions ( the slides from the past classes) and reminded us that our exam was only about 19 days away.
In slide 1 we looked at putting all the information we had done so far to a problem.
Sorry I'll finish up later my pictures don't want to work
The next scribe Is........I think were starting a new cycle
Thursday, April 26, 2007
BOB
Oh my, this month flew right by, just like this unit. So now we have come to the end of the unit "vectors". I wasn't sure what to expect in this unit whether it was to be difficult or quite easy, but now i realize it was a little bit of both. The two quizzes we did the other day really explain my understanding of the unit. The morning quiz, which had scalar diagrams, definitions etc was no problem I understood that stuff very well. The afternoons quiz was okay I'm good with word problems as long as I don't have to move the vectors, once that comes along to me it becomes confusing. That's were I seem to have a problem, also sometimes I know when I'm supposed to use the program on the calculator and other times I'm not to sure. But i do like drawing the pictures/diagrams with the measurement's and angles it ends up being quite fun.I don't know about some parts of the unit but hopefully there won't be too many questions about the stuff I have a hard time with. I hope I do well on the unit test, I need to boost up my mark. Good luck everyone!
-Britt<3
-Britt<3
Wednesday, April 18, 2007
Scribe Wednesday, April.18/07
Well here's the scribe for Wednesday, April.18/07 sorry it's a little late but I had work today and my Internet decided not to publish my written scribe twice, so maybe the third times the charm.
First off we talked about a collaboration project with a grade 9 computer class in New York City for our D.E.V projects. We would get the content done the problems as well as their solutions and send it over to our partners in New York. They would then make it as some would say "look Pretty" but you are responsible for telling them what you want, keeping in touch with them and making suggestions after all you will be marked on their work too. If you choose to participate in this a one week extension on your project will be given. The dilemma is Mr.K needed to know by today, but as we all noticed in class everyone has chosen I believe to do their D.E.V projects independently.
We also learned how to make a Wiki, the one thing we thought was quite complicated but in reality wasn't.
Here are the steps:
1. First go to http://pbwiki.com
2. Then choose a wiki name (example. 12345@pbwiki.com) and type your e-mail address.
3. Next wait for an e-mail to be sent to your account, in that e-mail there will be a link click on it and enter the information provided
*remember
- Don't use your last name just your last initial
- click "educational" as purpose
- and accept their terms
That's about it short and sweet, you know have a wiki:)
We then continued onto yesterday's topic of word problems with vectors.

Next we moved onto a dictionary slide, showing the different ways to name a vector entitled "General Notation for a Vector". Also a vector can be named with two V's (VV) as well. Then the secondary slide which is also a dictionary slide shows the definitions for Equivalent Vectors, Opposite Vectors, and The Zero Vector.
Then we moved onto the next slide.

Well ladies and gentlemen thats all for me today.
The next scribe will be...KyLe
Bye, Bye
-Britt<3
First off we talked about a collaboration project with a grade 9 computer class in New York City for our D.E.V projects. We would get the content done the problems as well as their solutions and send it over to our partners in New York. They would then make it as some would say "look Pretty" but you are responsible for telling them what you want, keeping in touch with them and making suggestions after all you will be marked on their work too. If you choose to participate in this a one week extension on your project will be given. The dilemma is Mr.K needed to know by today, but as we all noticed in class everyone has chosen I believe to do their D.E.V projects independently.
We also learned how to make a Wiki, the one thing we thought was quite complicated but in reality wasn't.
Here are the steps:
1. First go to http://pbwiki.com
2. Then choose a wiki name (example. 12345@pbwiki.com) and type your e-mail address.
3. Next wait for an e-mail to be sent to your account, in that e-mail there will be a link click on it and enter the information provided
*remember
- Don't use your last name just your last initial
- click "educational" as purpose
- and accept their terms
That's about it short and sweet, you know have a wiki:)
We then continued onto yesterday's topic of word problems with vectors.

Next we moved onto a dictionary slide, showing the different ways to name a vector entitled "General Notation for a Vector". Also a vector can be named with two V's (VV) as well. Then the secondary slide which is also a dictionary slide shows the definitions for Equivalent Vectors, Opposite Vectors, and The Zero Vector.
Then we moved onto the next slide.

Well ladies and gentlemen thats all for me today.
The next scribe will be...KyLe
Bye, Bye
-Britt<3
Wednesday, April 11, 2007
BOB
Well yet agin another BOB, I feel as if I just did one..haha. But anyway this unit was different it took a while to wrap my head around it, for the math itself isn't difficult, it's understanding the amaterial and remembering what to do. I really wish we could have done the test before spring break because I felt that I knew most of the stuff, but now i feel a little lost, when I went back to try to do old questions it was ahrd to remember. I couldn't remember some stuff I almost felt as if I had to re-learn it. Hopefully I do well on this test, I really wnat my term mark to go up. Best of luck guys!
-Britt<3
-Britt<3
Monday, April 2, 2007

Sunday, March 18, 2007
Scribe (March.16/07)
Hello Ladies and Gentlemen this is the scribe post for Friday, March 16/07. Sorry It wasn't posted until today but I had a concert last night PCD and Christina A, which was if I may add amazing but anywaise.
Here we go...
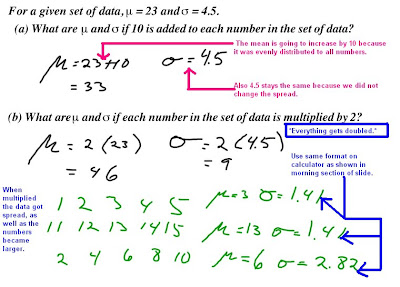 Well that's all for me enjoy the rest of your weekend
Bye bye
-Brittany<3>
Here we go...
Morning class:
**We started off with doing the "lets warm up" slide.
**We started off with doing the "lets warm up" slide.
 Part 1 (Slide 1&2)
In the Black Box--->For the calculations of the "mean" and "standard deviation" we don't use the first column in the table because it's a "range" therefore you do not know the exact number, and we use "1-VARS Stats" on our calculators.
In the Purple box---> We are looking for the number of students that have marks WITHIN the standard deviation. Within is a key word because that can mean -1 standard diviation or +1 standard deviation. So we calculate the mean + standard deviation as well as the mean - the standard deviation.
* The blue lettering means that # of students that fall in the red and green part.*
The last part---> We added the blue circled part in teh table and divided it by the numeber of students in total.
Part 2 (Slide 3)
Calculator functions for this side are:
1. Go into lists [ STAT, option 1]
2. In List 1 (L1) put in the marks. [33,42,51,60,69,78,87,96]
3. In List 2 (L2) put in number of students. [1,4,12,18,24,16,7,3]
4. Exit the screen [2nd MODE]
5. STAT > to option one "1-Var Stats" then ENTER
6. Then press 2ND #1 then the comma (,) 2ND #2 then ENTER
7.Press 2ND Y= to stat plots then press ENTER turn state plot "ON" Key down, make sure the "type" is a Histogram.
8. In "Xlist" make sure L1 is there9. In "FREQ" make sure it's L2
10. Adjust Window settings.
x-min= 29 [ Because it's the lowest mark a student can have in the table]
x-max=101 [Because we have to include the possibility of a student getting 100% on a test]
xscl=9 [Because thats the number of numbers inbetween each range]
ymin= -10 [Because we need to see all values once graphed]
ymax= 30 [Because there are 24, and you ant to show that changes at the top of the screen]
Yscl= 5
Xres=1
11. Press GRAPH
** Next we went onto dictionary slides (slide # 4-# 7)
We looked at "Standard Normal Curve" The numbers on the bottom of the curve is the standard deviation.
1.000 is one standard deviation above the "mean" which is 0.000
-1.000 is one standard deviation below the "mean which is 0.000
Also at the this point Mr.k mentioned an interesting fact although it has nothign to do with this topis but...
Did you know that IQ test do not really measure your intelligence?
Anyway....
Bell-shaped Curve
-Most things fall one standard deviation of the mean.
*REMINDER*
When you know the standard deviation and the mean you know the spread of how much of the mean is in each standard deviation.
Definitions:
-ZScore: Which tells how many standard deviations you are from the mean.
(Beth and Burt example)
-Six Sigma: Example most companie can't satisfiy all their customers but they try to satisfy six sigma or 99% of them, it all related back to statitics.
* The 68-95-99 rule basically describes all*
(refer to slide # 7)
Afternoon
We applied the information we learned in the morning class to real questions.
Slide #8 Questions we reffered back to the Bell shaped Curve as shown in a picture above.
a.) 358---> zscore is 2 standard deviations away from the mean
352---> z score is -4
Next we as a class put together a formula together sort of that would help us solve question b. 
Next we moved onto some more questions.
Well that's all for me enjoy the rest of your weekendBye bye
-Brittany<3>
PS. The next scribe is ummmmm Jenn
Monday, March 12, 2007
BOB
Well the Probability test is tomorrow, yes tomorrow. This unit was hard to grasp for me, for some reason I just couldn't wrap my head around it. It was weird because in class I would be confused and then we would talk about it as a class and I completely understood it, but once I got home for some reason I once againw as confused. My problem I think was doing the first step, just getting to that point because once I got through that I was normally okay. My favorite part was probably the tree diagrams I kinda like those. Over all this unit was not one I excelled in, but hopefully I will do well on the test. Good luck guys!
-Brittany<3
-Brittany<3
Thursday, March 1, 2007
March.1,2007 (PROBABILITY)
Hello everyone, sorry about the long wait but here's the scribe for Thursday, March.1/07.
The first thing we did was make a correction in our dictionary notes, for an error was found. In the slide post for Tuesday, Febuary.27/07 under "combinations (the "choose" formula) heading. The slide currently says:
"A permutation is an ordered arrangement of objects"
We changed that to:
"A combination is an arrangement of objects were order does not matter."
Next we moved onto our "let's warm up" slide, this question ended up taking up most of the period. It was a question very similar to one we had done in a past class.
Question:
There is a 10 question multiple choice test, with four possible choices for each question. What is the probability of scoring at least 10% on the test if you guess each answer?
There are two ways to answer this question an easy way and a hard way.
*Method #1 (the long way)*
This is where you calculate the probability of getting each number of questions right on the test, 2/10, 3/10, 4/10, etc up to 10/10. When all 11 are added up the probabilities should equal 100%.
*Method #2 (short cut)*
Solving for the "compliment" also known as the opposite.
This method works because the question is asking for the probability of getting at least 10%, so that means 1-10 questions right. So you calculate the probability of getting all the questions wrong, which leaves the probability of getting them all right.
This "compliment" method is not only less work but it takes up much less time. But if an individual was to use method #1 it would not be marked wrong. But in a timed event such as a test the "compliment" method would come in handy.
Next we got to a surprise quiz, we didn't get a chance to correct the whole thing, but we went over some must know guidelines to the first question.
*Reminder:
-All tree diagrams start with a dot, as a student already stated in past scribe.
-Also a legend is always something good to write down when solving a question with a tree diagram.
Well ladies and gentlemen that's all for me, sorry it took while but here it is finally.
The scribe for Friday's class is/was Donna.
Bye bye
Brittany<3
The first thing we did was make a correction in our dictionary notes, for an error was found. In the slide post for Tuesday, Febuary.27/07 under "combinations (the "choose" formula) heading. The slide currently says:
"A permutation is an ordered arrangement of objects"
We changed that to:
"A combination is an arrangement of objects were order does not matter."
Next we moved onto our "let's warm up" slide, this question ended up taking up most of the period. It was a question very similar to one we had done in a past class.
Question:
There is a 10 question multiple choice test, with four possible choices for each question. What is the probability of scoring at least 10% on the test if you guess each answer?
There are two ways to answer this question an easy way and a hard way.
*Method #1 (the long way)*
This is where you calculate the probability of getting each number of questions right on the test, 2/10, 3/10, 4/10, etc up to 10/10. When all 11 are added up the probabilities should equal 100%.
            10!               1   ^0       3   ^10
     _________ * { ___ }   * { ___ }   =0.563135147 =6%
         (10!0!)            4               4

             10!              1    ^1       3   ^9
     _________ * { ___ }   * { ___ }   =0.1877117157 =18%
          (9!1!)             4               4

            10!               1    ^2       3    ^8
     _________ * { ___ }   * { ___ }   =0.2815675735 =28%
          (8!2!)              4              4

            10!                1    ^3      3    ^7
     _________ * { ___ }   * { ___ }   =0.2502822876 =25%
          (7!3!)              4              4

            10!                1   ^4       3   ^6
     _________ * { ___ }   * { ___ }   =0.1459980011 =14%
          (6!4!)              4              4

            10!               1    ^5       3    ^5
     _________ * { ___ }   * { ___ }   =0.0583992004 =6%
          (5!5!)             4               4

            10!                1  ^6        3  ^4
     _________ * { ___ }   * { ___ }   =0.0162220001 =2%
          (4!6!)              4              4

           10!                 1  ^7        3  ^3
     _________ * { ___ }   * { ___ }   =0.0030899048
          (3!7!)              4              4

            10!                1  ^8        3  ^2
     _________ * { ___ }   * { ___ }   =3.862380981E-4
          (2!8!)              4              4

            10!                1  ^9         3  ^1
     _________ * { ___ }   * { ___ }   =2.861022949E-5
          (1!9!)              4               4
*Method #2 (short cut)*
Solving for the "compliment" also known as the opposite.
              10!                  1               3
 1 - __________ * {_____} * {_____}
           (10! 0!)               4               4

                   3     ^10
    = 1 - {_____}
                   4

    =0.9437

    =94.37%
This method works because the question is asking for the probability of getting at least 10%, so that means 1-10 questions right. So you calculate the probability of getting all the questions wrong, which leaves the probability of getting them all right.
This "compliment" method is not only less work but it takes up much less time. But if an individual was to use method #1 it would not be marked wrong. But in a timed event such as a test the "compliment" method would come in handy.
Next we got to a surprise quiz, we didn't get a chance to correct the whole thing, but we went over some must know guidelines to the first question.
*Reminder:
-All tree diagrams start with a dot, as a student already stated in past scribe.
-Also a legend is always something good to write down when solving a question with a tree diagram.
This is not something that needs to be done now, but later on it will be needed, and will help make your answers a lot easier to understand (read).
Example:

 o=oatmeal
 p=pancakes
Well ladies and gentlemen that's all for me, sorry it took while but here it is finally.
The scribe for Friday's class is/was Donna.
Bye bye
Brittany<3
Sunday, February 18, 2007
BOB
Well now that we have come to an end to this unit Matrices. When we first started this unit I was confused but I quickly caught on to adding, subtracting etc. But than we started "multiplying matrices" I was completely stuck, and the "fingering method", didn't help me out to much either. But then I started to ask some questions and bug my classmates , so I finally figured things out. With "transition Matrices" it confused me at the beginning, but then I finally got the nerve to ask Mr K for help and we found out where I was screwing up with those questions. I really want to do well in this course, and i really hope I get a good mark on the test... -Britt
Subscribe to:
Posts (Atom)


